Target ScannerThis invite-only indicator implements an advanced Wolfe Wave pattern recognition system specifically designed for Borsa Istanbul (BIST) stock screening across multiple timeframes and mathematical ratio calculations.
**Core Technical Framework:**
The indicator employs sophisticated mathematical calculations across 10 distinct timeframes (377, 233, 144, 89, 55, 34, 21, 13, 8, 5 periods) using Elliott Wave ratio theory combined with algorithmic pattern detection. Unlike standard scanning tools that rely on basic technical indicators, this system uses quantitative Wolfe Wave analysis to identify precise entry and exit points across 560+ BIST stocks simultaneously.
**Key Features:**
• **Multi-Stock Scanning:** Simultaneously analyzes 40 stocks per list across 14 different BIST stock lists (560+ total stocks)
• **Advanced Pattern Detection:** Implements Wolfe Wave mathematical validation using 24 different ratio calculation methods including Fibonacci sequences, Elliott Wave ratios, Golden Ratio, Harmonic Patterns, Pi-based calculations, volatility-based dynamic ratios, and AI-optimized mathematical progressions
• **Real-Time Screening Table:** Displays active signals with current price, signal price, target price, expected profit percentage, and calculated stop-loss levels
• **Reliability Scoring System:** EPA (Entry Point Accuracy) and ETA (Exit Target Accuracy) scoring with historical performance tracking
• **Visual Signal Display:** Comprehensive signal boxes showing profit zones, stop-loss areas, entry levels, and estimated time to target completion
**Mathematical Implementation:**
The core algorithm calculates price relationships using configurable mathematical ratios. For bullish conditions, it identifies entry points when price action meets specific criteria:
- Point validation through ratio analysis between swing highs/lows across multiple timeframes
- Mathematical confirmation using (pv - pf) / (pv - pd) ratio calculations
- Confluence validation across timeframes with dynamic ratio adjustments
- Minimum profit threshold filtering to ensure signal quality
**Originality and Innovation:**
This implementation differs significantly from traditional scanning tools through several key innovations:
1. **Multi-Timeframe Wolfe Wave Detection:** Simultaneous pattern recognition across 10 timeframes rather than single-timeframe analysis
2. **Adaptive Ratio Systems:** 24 different mathematical calculation methods including volatility-based, time-based, momentum-based, and volume-weighted ratio adjustments
3. **BIST-Specific Optimization:** Tailored specifically for Turkish stock market characteristics with 14 pre-configured stock lists
4. **Institutional-Grade Visualization:** Advanced signal boxes with profit/loss zones, multiple entry levels, and time-based target estimation
5. **Real-Time Performance Tracking:** Dynamic EPA/ETA scoring system that tracks historical accuracy and adapts calculations
**Signal Generation Logic:**
The system generates signals when multiple mathematical conditions align:
- Wolfe Wave pattern completion across specified timeframes
- Ratio validation using selected mathematical progression (Fibonacci, Golden Ratio, Elliott Wave, etc.)
- Stop-loss calculation as percentage of target profit (default 0.5%)
- Minimum profit threshold compliance
- Multi-timeframe confluence confirmation
**Risk Management Features:**
• **Configurable Stop-Loss:** Calculated as percentage of target profit with recommended 0.3 setting for 1:3 risk-reward ratio
• **Profit Percentage Display:** Real-time calculation showing expected profit from signal price to target
• **Multiple Entry Levels:** EPA and ETA-based entry points with reliability scoring
• **Time Estimation:** Statistical analysis providing estimated bars/time to target completion
• **Visual Risk Zones:** Color-coded profit (green) and loss (red) areas for clear risk visualization
**Performance Characteristics:**
The indicator is optimized for active screening with frequent signal generation across multiple stocks. It provides both short-term and medium-term opportunities depending on the timeframe producing the signal. The system maintains historical statistics for signal accuracy and target completion timing.
**Technical Requirements:**
Requires understanding of Wolfe Wave pattern theory, Elliott Wave principles, and multi-timeframe analysis concepts. Users should be familiar with BIST market structure and Turkish stock trading mechanics. The indicator demands active monitoring due to the high-frequency nature of multi-stock scanning.
**Market Application:**
Specifically designed for Borsa Istanbul stocks with comprehensive coverage across major sectors. Works effectively in both trending and ranging market conditions due to its adaptive ratio selection and multi-timeframe approach. Best suited for traders focusing on Turkish equity markets with pattern-based strategies.
**Customization Options:**
• **14 Stock Lists:** Pre-configured BIST stock groups for sector-specific analysis
• **24 Ratio Methods:** From conservative Fibonacci to aggressive AI-optimized calculations
• **Quote Pair Integration:** Optional currency pair specification for international analysis
• **Timeframe Flexibility:** Customizable chart timeframe for signal generation
• **Table Positioning:** Multiple display options with size and color customization
• **Alert Integration:** Comprehensive alert system for real-time signal notifications
Search in scripts for "swing high low"

AsturRiskPanelIndicator Summary
ATR Engine
Length & Smoothing: Choose how many bars to use (default 14) and the smoothing method (RMA/SMA/EMA/WMA).
Median ATR: Computes a rolling median of ATR over a user-defined look-back (default 14) to derive a “scalp” target.
Scalp Target
Automatically set at ½ × median ATR, snapped to the nearest tick.
Optional rounding to whole points for simplicity.
Stop Calculation
ATR Multiplier: Scales current ATR by a user input (default 1.5) to produce your stop distance in points (and ticks when appropriate).
Distortion Handling: Switches between point-only and point + tick displays based on contract specifications.
Risk & Sizing
Risk % of account per trade (default 2 %).
Calculates dollar risk per contract and optimal contract count.
Displays all metrics (scalp, stop, risk/contract, max contracts, max risk, account size) in a customizable on-chart table.
ATR-Based Stop Placement Guidelines
Trade Context ATR Multiplier Notes
Tight Range Entry 1.0 × ATR High-conviction, precise entries. Expect more shake-outs.
Standard Trend Entry 1.5 × ATR Balanced for H2/L2, MTR, DT/DB entries.
Breakouts/Microchannels 2.0 × ATR Wide stops through chop—Brooks-style breathing room.
How to Use
Select ATR Settings
Pick an ATR length (e.g. 14) and smoothing (RMA for stability).
Adjust the median length if you want a faster/slower scalp line.
Align Multiplier with Your Setup
For tight-range entries, set ATR Multiplier ≈ 1.0.
For standard trend trades, leave at 1.5.
For breakout/pullback setups, increase to 2.0 or more.
Customize Risk Parameters
Enter your account size and desired risk % per trade (e.g. 2 %).
The table auto-calculates how many contracts you can take.
Read the On-Chart Table
Scalp shows your intraday target.
Stop gives Brooks-style stop distance in points (and ticks).
Risk/Contract is the dollar risk per contract.
Max Contracts tells you maximum position size.
Max Risk confirms total dollar exposure.
Visual Confirmation
Place your entry, then eyeball the scalp and stop levels against chart structure (e.g. swing highs/lows).
Adjust the ATR multiplier if market context shifts (e.g. volatility spikes).
By blending this sizing panel with contextual ATR multipliers, you’ll consistently give your trades the right amount of “breathing room” while keeping risk in check.

Vortex Sniper XVortex Sniper X – Trend-Following Strategy
🔹 Purpose
Vortex Sniper X is a trend-following strategy designed to identify strong market trends and enter trades in the direction of momentum. By combining multiple technical indicators, this strategy helps traders filter out false signals and only take trades with high confidence.
🔹 Indicator Breakdown
1️⃣ Vortex Indicator (Trend Direction & Strength)
Identifies the trend direction based on the relationship between VI+ and VI-.
Bullish Signal: VI+ crosses above VI-.
Bearish Signal: VI- crosses above VI+.
The wider the gap between VI+ and VI-, the stronger the trend’s momentum.
2️⃣ Relative Momentum Index (RMI – Momentum Confirmation)
Confirms whether price momentum supports the trend direction.
Long confirmation: RMI is rising and above the threshold.
Short confirmation: RMI is falling and below the threshold.
Filters out weak trends that lack sufficient momentum.
3️⃣ McGinley Dynamic (Trend Baseline Filter)
A dynamic moving average that adjusts to market volatility for smoother trend identification.
Long trades only if price is above the McGinley Dynamic.
Short trades only if price is below the McGinley Dynamic.
Prevents trading in choppy or sideways markets.
🔹 Strategy Logic & Trade Execution
✅ Entry Conditions
A trade is executed only when all three indicators confirm alignment:
Trend Confirmation: McGinley Dynamic defines the trend direction.
Vortex Signal: VI+ > VI- (bullish) or VI- > VI+ (bearish).
Momentum Confirmation: RMI must agree with the trend direction.
✅ Exit Conditions
Trend Reversal: If the opposite trade condition is met, the current position is closed.
Trend Weakness: If the trend weakens (detected via trend shifts), the position is exited.
🔹 Take-Profit System
The strategy follows a multi-stage profit-taking approach to secure gains:
Take Profit 1 (TP1): 50% of the position is closed at the first target.
Take Profit 2 (TP2): The remaining 50% is closed at the second target.
🔹 Risk Management (Important Notice)
🔴 This strategy does NOT include a stop-loss by default.
Trades rely on trend reversals or early exits to close positions.
Users should manually configure a stop-loss if risk management is required.
💡 Suggested risk management options:
Set a stop-loss at a recent swing high/low or an important support/resistance level.
Adjust position sizing according to personal risk tolerance.
🔹 Default Backtest Settings
To ensure realistic backtesting, the following settings are used:
Initial Capital: $1,000
Position Sizing: 10% of equity per trade
Commission: 0.05%
Slippage: 1 pip
Date Range: Can be adjusted for different market conditions
🔹 How to Use This Strategy
📌 To get the best results, follow these steps:
Apply the strategy to any TradingView chart.
Backtest before using it in live conditions.
Adjust the indicator settings as needed.
Set a manual stop-loss if required for your trading style.
Use this strategy in trending markets—avoid sideways conditions.
⚠️ Disclaimer
🚨 Trading involves risk. This strategy is for educational purposes only and should not be considered financial advice.
Past performance does not guarantee future results.
Users are responsible for managing their own risk.
Always backtest strategies before applying them in live trading.
🚀 Final Notes
Vortex Sniper X provides a structured approach to trend-following trading, ensuring:
✔ Multi-indicator confirmation for higher accuracy.
✔ Momentum-backed entries to avoid weak trends.
✔ Take-profit targets to secure gains.
✔ No repainting—historical performance aligns with live execution.
This strategy does not include a stop-loss, so users must apply their own risk management methods.

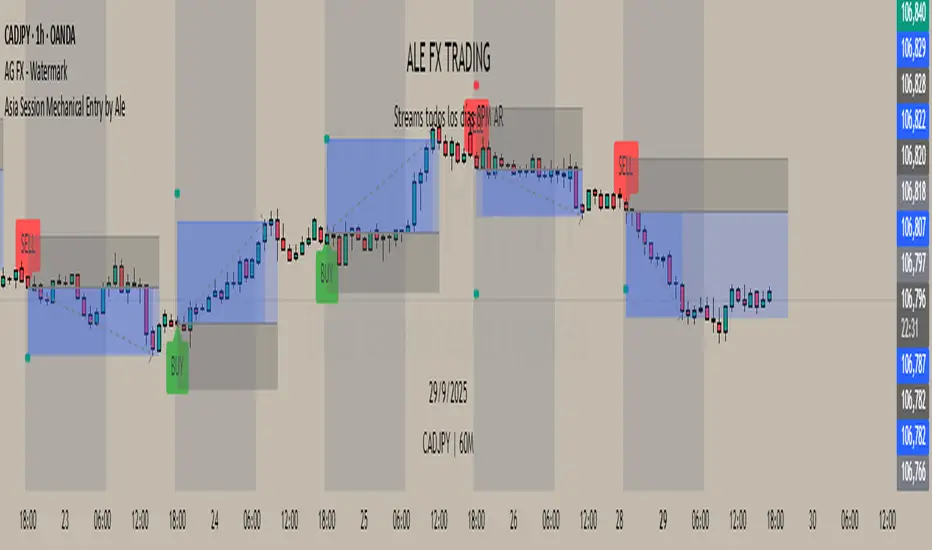
Asia Session Mechanical Entry by Alex This indicator executes fully mechanical trades at the start of the Asian session (default: 20:00 Argentina time).
Core logic:
Compares the closing prices of the previous two sessions at 20:00 and 09:00 to determine bias.
If both days move in the same direction, the indicator takes a mean-reversion trade (opposite to the last two days’ move).
If the days move in opposite directions, the trade follows the most recent day’s direction.
Execution details:
Entry price: exact session open or delayed by a user-defined number of candles.
Stop Loss: nearest swing high/low ± ATR multiplier buffer.
Take Profit: calculated from entry to SL distance, multiplied by user-defined RR ratio.
ATR value plotted for volatility reference.
Works on H1 charts for consistent candle timing.
Features:
Adjustable start/end session times.
Configurable ATR multiplier, RR ratio, and delay before entry.
Manual overrides for SL/TP levels.
Automatic daily reset for next session's logic.
Notes:
This tool is based on a classic session-reversion model enhanced with ATR-based filters, flexible timing, and manual overrides. It is designed for systematic execution and quick visual backtesting.
MindsetYourTrades Indicator V1What it does
• Finds swing highs/lows, projects dynamic trendlines
• Marks BUY/SELL at trendline breakouts
• Optional MA + RSI filter and cooldown to reduce noise
How to use
Add to chart → choose market & timeframe
If you want fewer signals: enable Filtered (MA + RSI) and increase Cooldown
For clean signals: leave Only signal on bar close = ON
Notes
• This V1 edition is visual only (no alerts/webhooks)
• Alerts + automation will be added through updates
Disclaimer
Educational use only. Not financial advice. You are responsible for your trades.

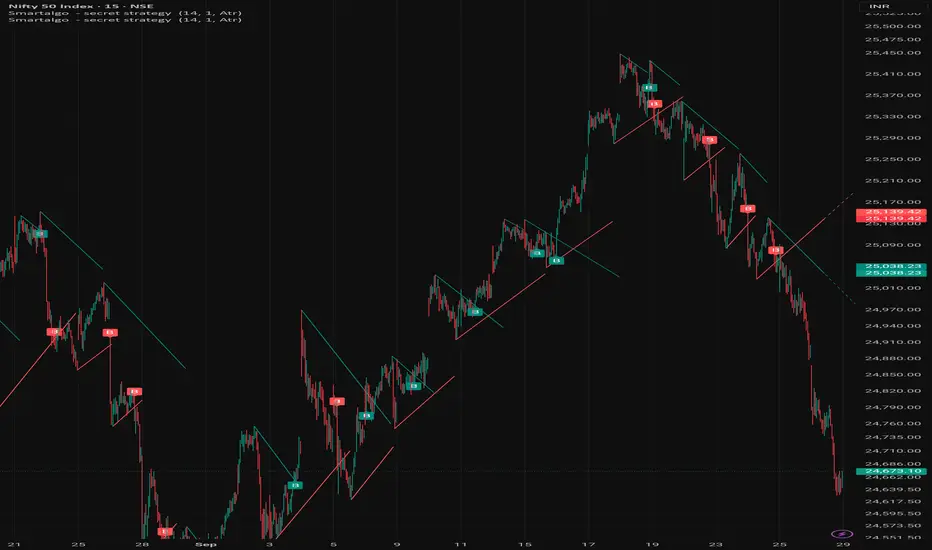
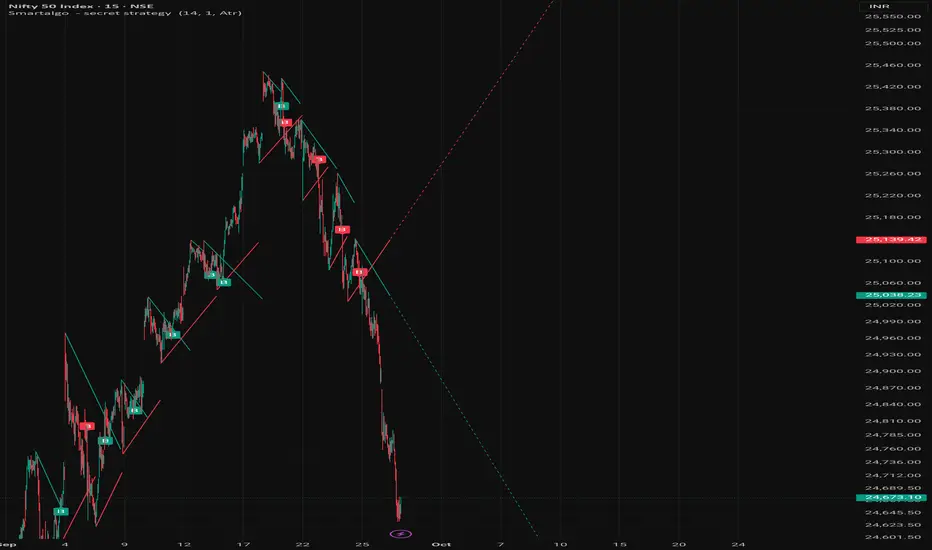
Smart Algogn2 [ChartPrime]Smart Algo gives you clear entry & exit signals using advanced price action logic. Built for traders who want consistency and speed.
> The B symbols are the entry points
> Previous swing high/low is the SL
> Keep 1:2 OR 1:1.5 Risk-Reward

secret strategy [Smartalgo ]Smart Algo gives you clear entry & exit signals using advanced price action logic. Built for traders who want consistency and speed.
> The B symbols are the entry points
> Previous swing high/low is the SL
> Keep 1:2 OR 1:1.5 Risk-Reward

secret strategy [Smartalgo ]Tired of false breakouts and random indicators?
Smart Algo gives you clear entry & exit signals using advanced price action logic. Built for traders who want consistency and speed.
> The B symbols are the entry points
> Previous swing high/low is the SL
> Keep 1:2 OR 1:1.5 Risk-Reward
secret strategy [Smartalgogn2 ]Tired of false breakouts and random indicators?
Smart Algo gives you clear entry & exit signals using advanced price action logic. Built for traders who want consistency and speed.
> The B symbols are the entry points
> Previous swing high/low is the SL
> Keep 1:2 OR 1:1.5 Risk-Reward
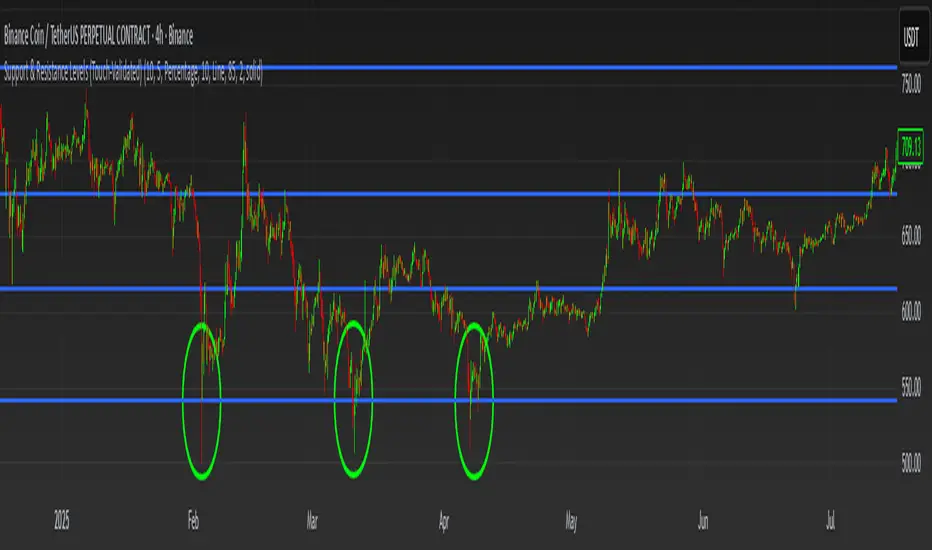
Support & Resistance Levels (DaruTrading)This Pine Script automatically identifies and locks key support and resistance levels using Williams-style fractals. Instead of manually drawing zones—a tedious and error-prone task—the script clusters repeated touches into clean levels or areas, complete with customizable styles and fills. By combining wick-based and close-based detection, it adapts to both swing highs/lows and body closes, capturing the levels traders actually respect. For risk management, this automation is powerful: consistent, objective zones reduce emotional bias, highlight true market structure, and provide reliable anchors for stop losses and targets. It streamlines a boring chore into a disciplined, data-driven trading edge.
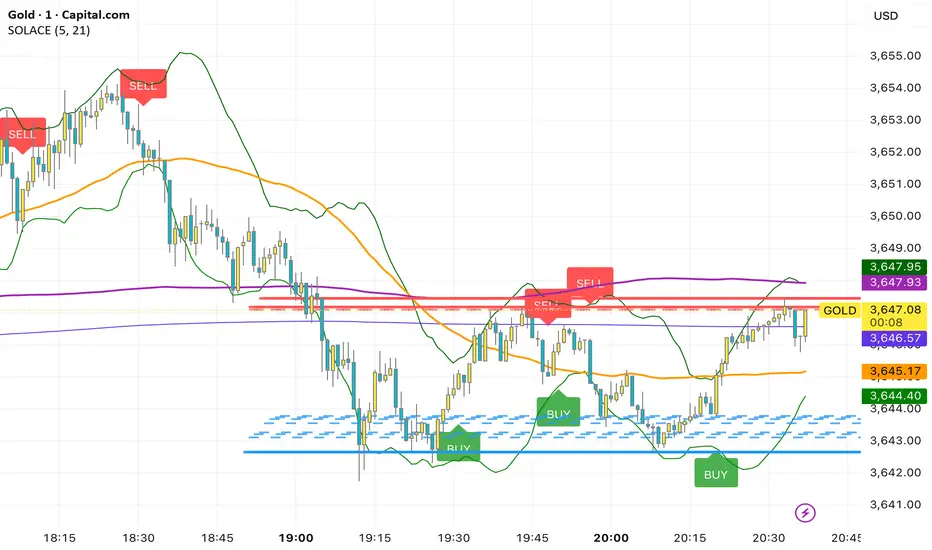
SOLACEThis overlay combines a fast/slow EMA price-action system with rich context tools. Buy prints on the current bar when both EMAs (5 & 21) are below the OHLC average and the 21 EMA crosses below the 5 EMA; Sell prints when both EMAs are above the average and the 21 EMA crosses above the 5 EMA. It also plots MACD, VWAP, Bollinger Bands (20,2), SMA50/200, plus dynamic support/resistance lines from recent swing highs/lows (20/40/60 bars) for confluence. Labels fire same-bar for early entries, and alerts are included for both signals; fractal logic is prepared for future use.
MONEYZEYAH | SMART TREND LINESAutomatically detects swing highs/lows, draws trend lines, marks key support/resistance levels, and highlights breakouts for fast trend analysis. 📈🚩

Bias AnalyzerBias Analyzer – Institutional Bias Scoring Tool
The Bias Analyzer combines multiple institutional trading concepts into a single adaptive scoring system. It calculates a directional bias score (0–100) by weighting volume, trend, structure, VWAP/imbalance, and momentum.
🔹 Main Features
Volume Bias → cumulative buy/sell pressure (customizable lookback)
Trend Bias → based on short-term moving average confirmation
Structure Bias → swing high/low detection with ATR filter
VWAP / Imbalance Bias → price relation to VWAP
Momentum Factor → adaptive impulse weighting
Final Bias Score → combined & volatility-adjusted (0–100 scale)
Flip Markers → optional EMA dots when bias changes
Bias Widget → on-chart display with long/short percentage and multiple style presets (Classic, Dark, Neon, Terminal, Gold, Midnight, Purple, etc.)
Custom Mode → fully user-defined widget colors
🔹 Use Case
This tool helps traders to quickly identify the institutional directional bias of the market.
It is designed as a decision-support indicator and not as an automated trading system.
© 2025 Project Pegasus
🎯 Super MA Arrows with Trend Bands🎯 Core Structure of the Indicator
1. Input Parameters Configuration
One of the most comprehensive indicators, featuring 50+ configurable variables, categorized into:
MA Settings: Define MA types and periods
Signal Settings: Customize signal conditions
Display Settings: Manage visual outputs
AI Settings: Enable/disable learning module
Multi-Timeframe Settings: Analyze across multiple timeframes
2. Moving Average & Envelope Calculations
The indicator employs multiple moving averages and an adaptive envelope:
Fast MA: Captures short-term movement (default: 9)
Slow MA: Reflects overall trend direction (default: 21)
Filter MA: Filters market noise (default: 50)
Envelope: Auto-adjusting support/resistance zones
3. Market Structure Analysis
Purpose: Confirm the market’s directional bias by evaluating swing highs/lows, breakouts, and consolidation zones.

Super MA Arrows with Trend Bands1. Input Parameters Configuration
One of the most comprehensive indicators, featuring 50+ configurable variables, categorized into:
MA Settings: Define MA types and periods
Signal Settings: Customize signal conditions
Display Settings: Manage visual outputs
AI Settings: Enable/disable learning module
Multi-Timeframe Settings: Analyze across multiple timeframes
2. Moving Average & Envelope Calculations
The indicator employs multiple moving averages and an adaptive envelope:
Fast MA: Captures short-term movement (default: 9)
Slow MA: Reflects overall trend direction (default: 21)
Filter MA: Filters market noise (default: 50)
Envelope: Auto-adjusting support/resistance zones
3. Market Structure Analysis
Purpose: Confirm the market’s directional bias by evaluating swing highs/lows, breakouts, and consolidation zones.

fast market structure Dynamic Support Resistance Candle ColorsA trend reversal occurs when the direction of the market changes from an uptrend to a downtrend or vice versa. It is typically confirmed by a shift in price structure, such as a break of key support or resistance, a change in swing highs/lows, or specific candlestick patterns
easy market structure finderA trend reversal occurs when the direction of the market changes from an uptrend to a downtrend or vice versa. It is typically confirmed by a shift in price structure, such as a break of key support or resistance, a change in swing highs/lows, or specific candlestick patterns like engulfing or pin bars. Indicators like RSI divergence or moving average crossovers can also support reversal identification. Reversals often follow a strong trend and signal a potential new direction in price movement

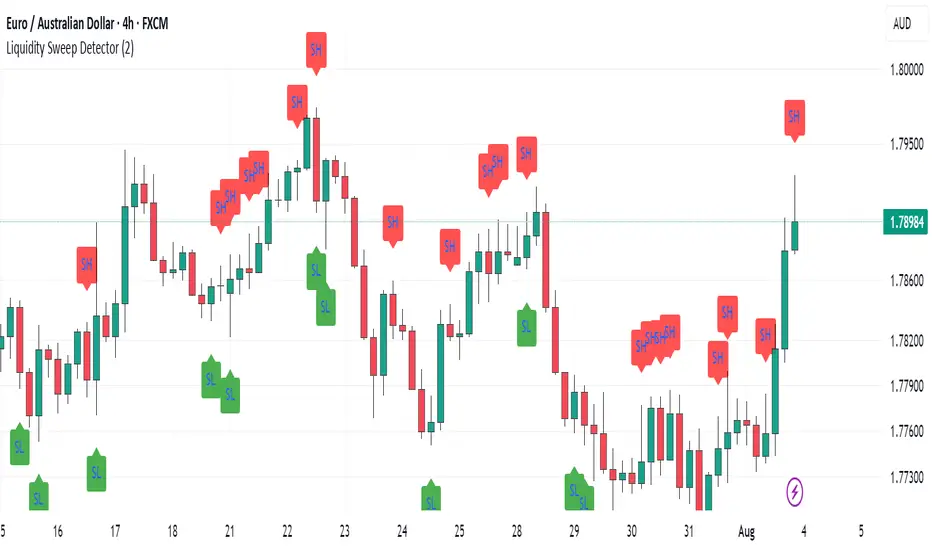
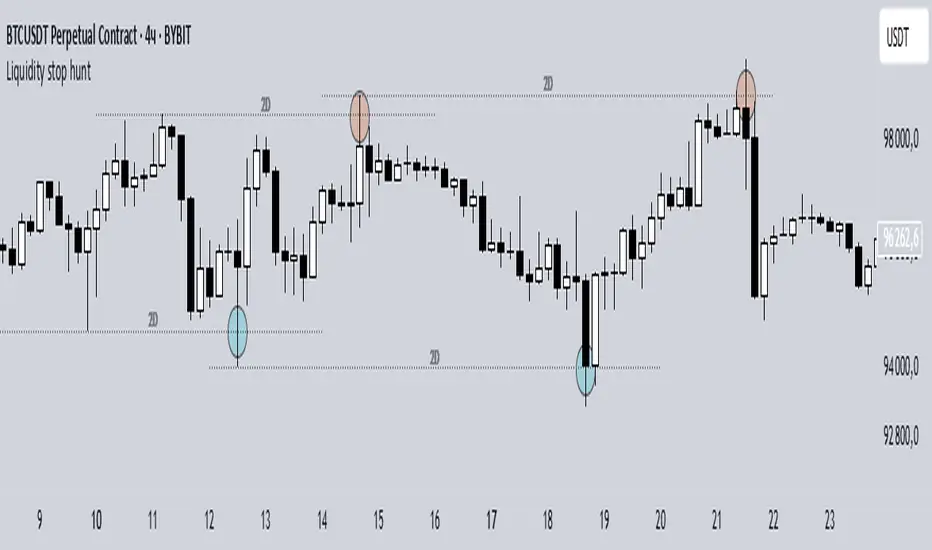
Liquidity stop huntThis tool identifies key liquidity zones where stop hunts are likely to occur.
**How it works:**
- Detects swing highs/lows on your selected timeframe.
- Marks levels where "liquidity sweeps" (fakeouts) often happen.
- Plots these zones as dotted lines for visual reference.
**How to use:**
1. Look for price rejections near marked levels.
2. Avoid placing stops too close to obvious liquidity zones.
3. Combine with price action for confirmation.
**Settings:**
- Timeframe: Choose the historical period for analysis (e.g., 1D, 1W).
- Sweep Type: "Wick Only" for precise tails, "Regular" for all breaks.
- Colors/Style: Customize appearance.
Note: Works best in trending markets. Not a standalone strategy — always confirm with additional analysis.
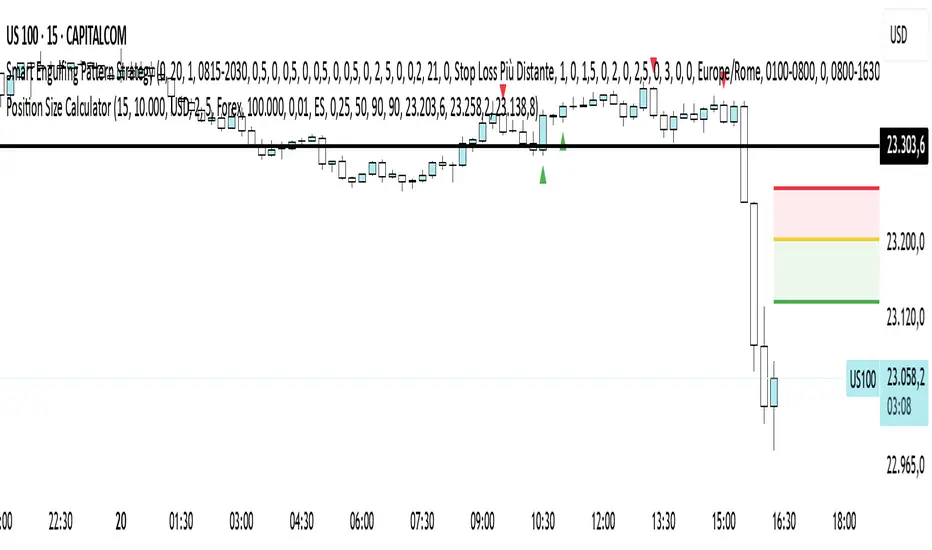
Position Size CalculatorPosition Size Calculator - User Guide
A simple tool to calculate optimal position size based on your risk preferences, visualize trade levels, and automatically determine trade direction.
Introduction
The Position Size Calculator is a TradingView indicator designed to help traders calculate the optimal position size for their trades based on account size and risk tolerance. This tool visually represents entry, stop loss, and take profit levels while automatically calculating the appropriate position size to maintain consistent risk management.
Getting Started
Setting Up Your Account Parameters
Setting Price Levels
Understanding the Visual Elements
Adjusting Your Trade on the Chart
Reading the Information Panel
1. Getting Started
After adding the indicator to your chart, you'll see three horizontal lines representing:
Yellow line: Entry price
Green line: Take profit price
Red line: Stop loss price
The indicator automatically detects whether you're planning a Long or Short trade based on the position of your take profit relative to your entry.
2. Setting Up Your Account Parameters
In the "Position Calculator" settings group:
Account Size : Enter your total account balance
Account Currency : Set your account currency (USD, EUR, etc.)
Risk (%) : Enter the percentage of your account you're willing to risk per trade (e.g., 2%)
Instrument Type : Select your trading instrument (Forex, Futures, Stocks, or Crypto)
Value per 0.01 lot per tick : Enter the value of 0.01 lots per tick (for most Forex pairs, this is $1 per pip for 0.01 lot)
Minimum Lot Size : Set the minimum lot size allowed by your broker (usually 0.01 for Forex)
3. Setting Price Levels
In the "Price Levels" section:
Entry Price : The price at which you plan to enter the trade
Stop Loss Price : Where you'll exit if the trade goes against you
Take Profit Price : Your target price where you'll take profits
If you set Entry Price to 0, it will default to the current price. If Stop Loss or Take Profit are set to 0, they'll default to 5% below or above entry price respectively.
4. Understanding the Visual Elements
Yellow line : Your entry price
Green line : Your take profit level
Red line : Your stop loss level
Green zone : The profit zone (between entry and take profit)
Red zone : The loss zone (between entry and stop loss)
Information panel : Shows all calculations and trade details
5. Adjusting Your Trade on the Chart
The beauty of this tool is its interactivity:
You can drag any of the lines directly on the chart to adjust entry, stop loss, or take profit
If you drag the take profit above the entry , the indicator automatically sets up for a Long trade
If you drag the take profit below the entry , it automatically configures for a Short trade
All calculations and visuals update in real-time as you adjust the lines
This means you can quickly test different scenarios and see how they affect your position size and potential profit/loss.
6. Reading the Information Panel
The information panel displays:
Account details : Your account size and currency
Risk information : Your percentage risk and the equivalent monetary amount
Position Size : The optimal lot size calculated based on your risk parameters
Price levels : Entry, Stop Loss, and Take Profit with distances in ticks
Risk/Reward ratio : Shown as 1:X (where X is the reward relative to 1 unit of risk)
Potential outcomes : The exact amount you stand to gain or lose on this trade
Trade direction : Whether this is a Long or Short trade
Visual Settings
You can customize the appearance in the "Visual" settings group:
Adjust colors for profit and loss zones
Change the transparency of colored zones
Toggle the filling of spaces between lines
Adjust how far the lines extend beyond the last candle
Practical Tips
Always double-check your "Value per 0.01 lot per tick" setting for the specific instrument you're trading
For Forex major pairs, the standard is usually $1 per pip for 0.01 lots
For other instruments, consult your broker's specifications
The indicator works best when you place your stop loss at a logical market level (support/resistance, swing high/low) rather than a fixed percentage
Final Thoughts
This Position Size Calculator helps remove emotion from your trading by objectively calculating your position size based on your predefined risk parameters. It ensures that you maintain consistent risk across all your trades, regardless of the stop loss distance, which is a key component of successful risk management.
Remember: The most important goal in trading is capital preservation. This tool helps you ensure that each trade risks only what you've decided is acceptable for your trading strategy.
EURUSD Swing High/Low ProjectionBikini Bottom custom projection tool. Aimed to project tops and bottoms. Don't use unless you understand how it works :)
Simple Market StructureThis indicator is meant for education and experimental purposes only.
Many Market Structure Script out there isn't open-sourced and some could be complicated to understand to modify the code. Hence, I published this code to make life easier for beginner programmer like me to modify the code to fit their custom indicator.
As I am not a expert or pro in coding it might not be as accurate as other reputable author.
Any experts or pros that is willing to contribute this code in the comment section below would be appreciated, I will modify and update the script accordingly as part of my learning journey.
It is useful to a certain extend to detect Market Structure using Swing High/Low in all market condition.
Here are some points that I am looking to improve / fix:
To fix certain horizontal lines that does not paint up to the point where it breaks through.
To add in labels when a market structure is broken.
Allow alerts to be sent when market structure is broken (Probably be done in the last few updates after knowing it is stable and as accurate as possible)
Any suggested improvement, please do let me know in the comment section below and I will try my best to implement it into the script.
Strategy Myth-Busting #13 - MultiEMA+BXTrender - [SP/MYN]#13 on the Myth-Busting bench, we are automating the "I Found The Highest Win Rate 15 Minute Scalping Trading Strategy Ever" strategy from "TradeIQ" who claims to have backtested this manually and achieved 410% profit over 100 trades within 6 months on Natural Gas with 79 Wins / 21 Losses with an astounding 3.96% Max Drawdown.
It was quite challenging emulating the same subjective EMA pullback logic along with the dependent sequencing of events necessary to enter a trade and we might improve on this to make it better in the future. Super kudos to @spdoinkal who helped with this strategy. If you have ideas on how this could be improved on, would love to hear about them.
As is, we were unable to substantiate similar results to what was manually backtested by TradeIQ, we do however see potential here. Given some optimizations and improvements to the the entry logic accommodating for a wider more variable margin after pullbacks reestablish above/below the fast EMA we think the performance of this strategy could certainly be improved upon. So not sure if we have totally myth busted this completely at this point in time.
This strategy uses a combination of 2 open-source public indicators:
3 EMA's (Trading View Internal)
B-Xtrender by Puppytherapy
Three separate (21), (89) and (200) EMA's are used as a means to confirm and keep entry out of ranged markets. When the 3 EMA's are all clumped up together with no distance it's indicative of a flat or ranged market. This is then used in conjunction with B-XTrender as a means to detect the trend direction. B-XTrender which is a trend following indicator originally published in the IFTA Journal by Bharat Jhunjhunwala. It uses both a short and long term lengths along with a compound EMA used as a means to smooth and sample trend direction.
Trading Rules
15 min candles but other lower time-frames
Stop Loss on previous swing high/low
No Take Profit, Exit on new red/green circles from BX-Trender
Long
EMA Green (21) on top, White (89)in middle and red (200) on bottom and there is distance between EMA's need to be spaced, otherwise in a ranged market
Price action must pull back into 89 EMA (White line) either close or touching it.
Once pullback occurs wait for BX Trender to issue a new green circle and BX Trend line must be green and above 0
Price action must also pull up back above the (Green Line) EMA 21
Short
EMA Red (200) on top, White (89) in middle and Green (21) on bottom and there is distance between EMA's need to be spaced, otherwise in a ranged market
Price action must pull back into 89 EMA (White line) either close or touching it.
Once pullback occurs wait for BX Trender to issue a new red circle and BX Trend line must be red and below 0
Price action must also pull up back below the (green Line) EMA 21
If you know of or have a strategy you want to see myth-busted or just have an idea for one, please feel free to message me.
